Motio ReportCard is a fantastic tool for analyzing and optimizing your Cognos performance. ReportCard can assess the reports in your environment, locate issues that cause a decline in performance, and present the results of how much performance can be improved by fixing the identified issue. Another important feature of ReportCard is the ability to continuously monitor your environment. This feature is known as “System Monitoring” and will be the focus of this blog, as we teach you how to set up alerts when performance goes outside of your expectations.
Understanding System Monitoring
Click on the “System Monitoring” tab from the top menu.
![]()
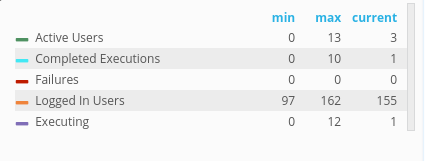
On the upper right hand corner, you will see the categories for “Current Cognos Activity.” These categories include active users, completed executions, failures, logged in users, and currently executing reports. The data for these categories are pulled from the Cognos audit database.
On the bottom right corner, you will see “Server.” This will display your Memory, CPU Percentage and Disk Usage of your servers.
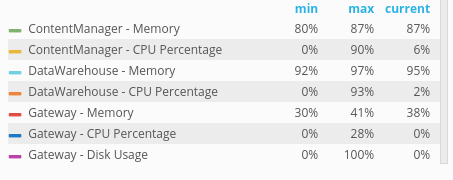
System Monitoring relies on “Current Cognos Activity” and “Server Metrics” to generate the appropriate alerts.
Setting Up System Monitoring
1. Click on “BI Environments” tab on the very top row.![]()
2. Proceed to “System Monitor” on the left-hand dropdown menu. Here you can add any email accounts that will be alerted by System Monitoring.
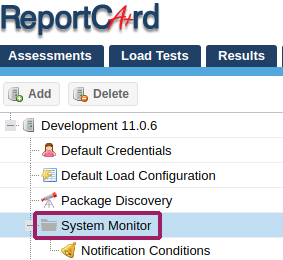
3. Next, click on “Notification Conditions” below
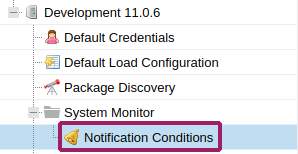
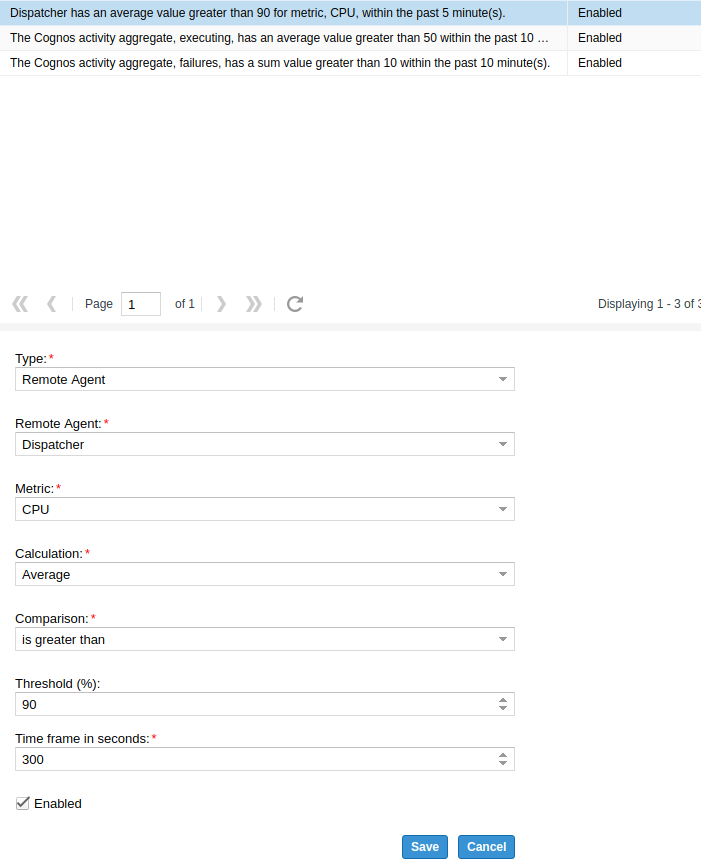
4. You can set up alerts that are tied to your “Current Cognos Activity” and “Server Metrics.” Click “Create” to begin setting up your alerts.
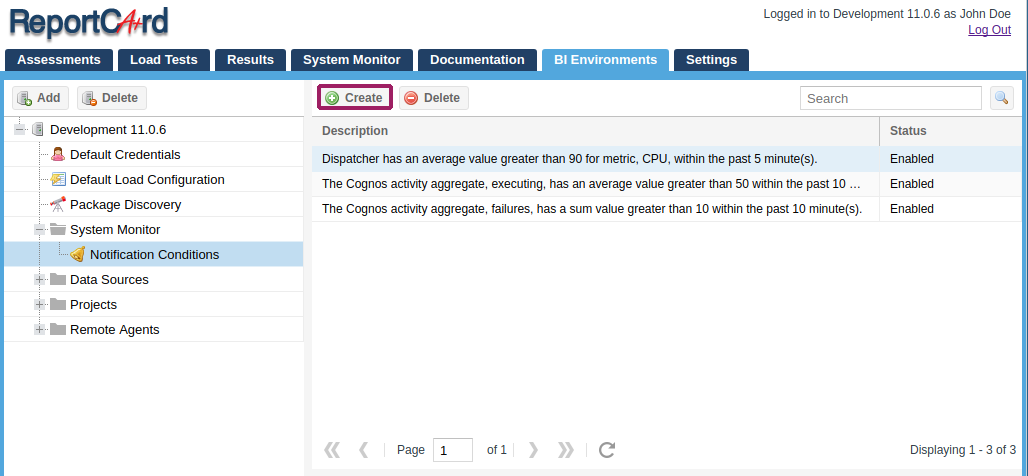
In this example, we have our notifications set up so that if our CPU usage spikes and averages over our 90% threshold in 5 minutes. We would be immediately alerted about this issue.
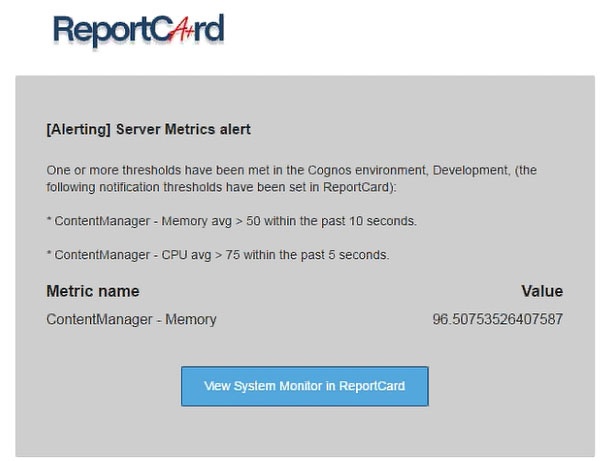
Server Metrics Alert
Here, we have an example of a “Server Metrics” alert email. This alert notifies us when the “Memory avg” is above 50 within the past 10 seconds, and if the “CPU avg” is above 75 within the past 5 seconds. We see that we were alerted because our “ContentManager – Memory” went above the specified “Memory avg” of 50. This alert is particularly useful to investigate why your Cognos Environment is slowing down.
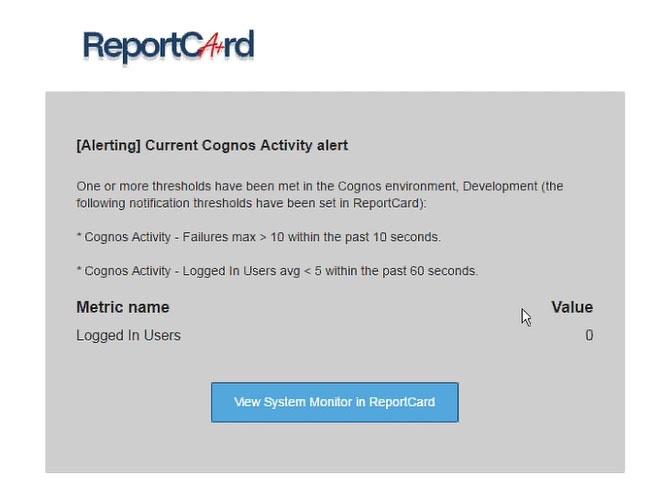
Current Cognos Activity Alert
Here, we have an example of an email alert about how many logged in users we have. This particular alert is notifying us that we have zero logged-in users within the past 60 seconds. This type of alert would be very useful to a Cognos Administrator who wants to conduct maintenance. So instead of waiting on usual off-peak hours, this alert would give valuable insight on when maintenance could be performed in your Cognos Environment.
Learn More About System Monitoring
There you have it! You have now set yourself up for a much easier position with identifying problems that may arise in your Cognos Environment! You can learn more about ReportCard on our website.
